KPMG Data Analytics Virtual Experience Program
- gracecamc168
- Aug 4, 2021
- 5 min read
This virtual project includes three tasks. Task one is to access data quality. Task two is to identify data insights. The last task is to present what we found from the data.
Background:
ABC company wants to know how to optimise its marketing strategy in order for growing its business eventually by effectively analyzing the three given datasets---customer demographic, customer addresses and transactions data in the past three months. The data from the three datasets is simulation data.
Data:
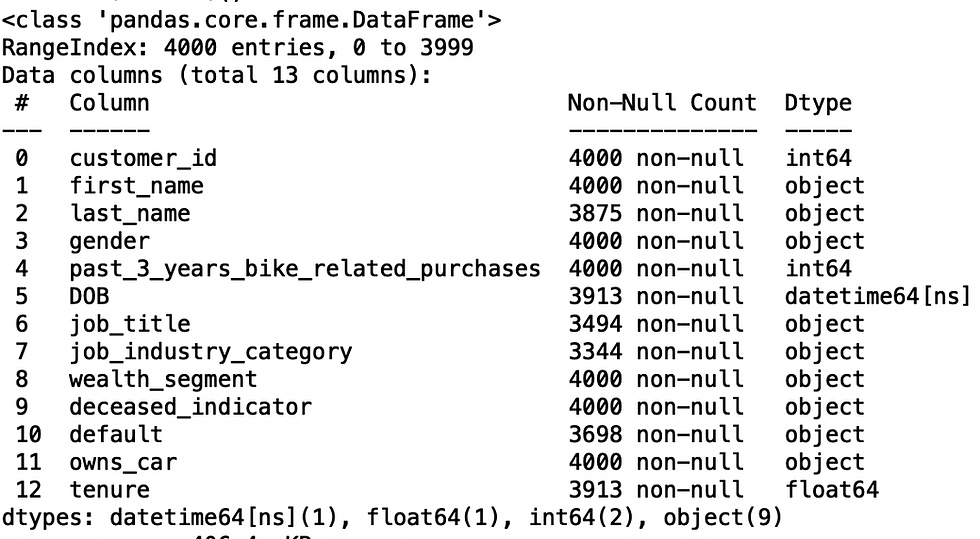
Customer demographic
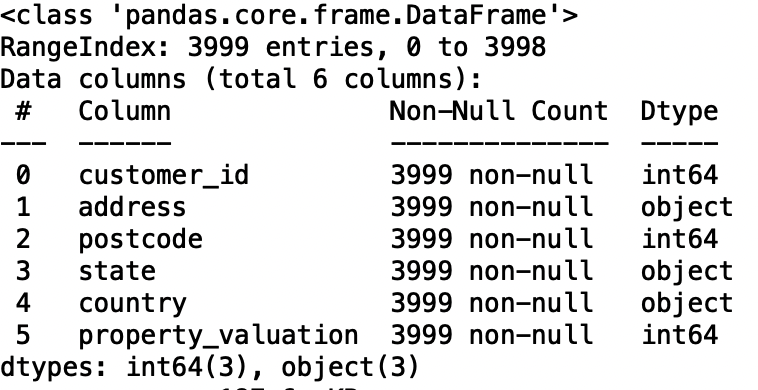
Customer addresses
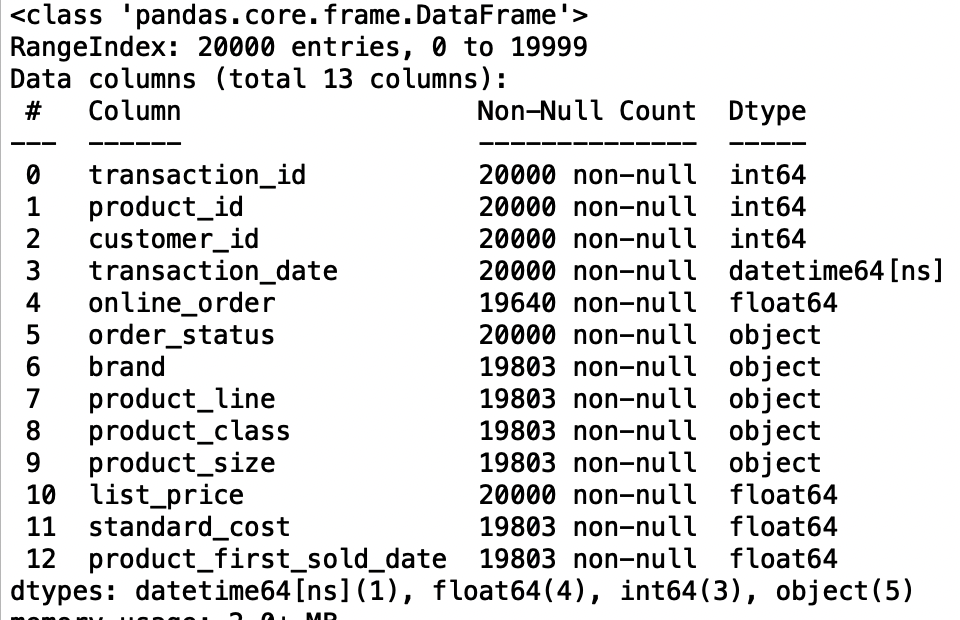
Transactions
The original data is available here.
Task one:Data Quality Assessment
I accessed the data by using the below dimension.
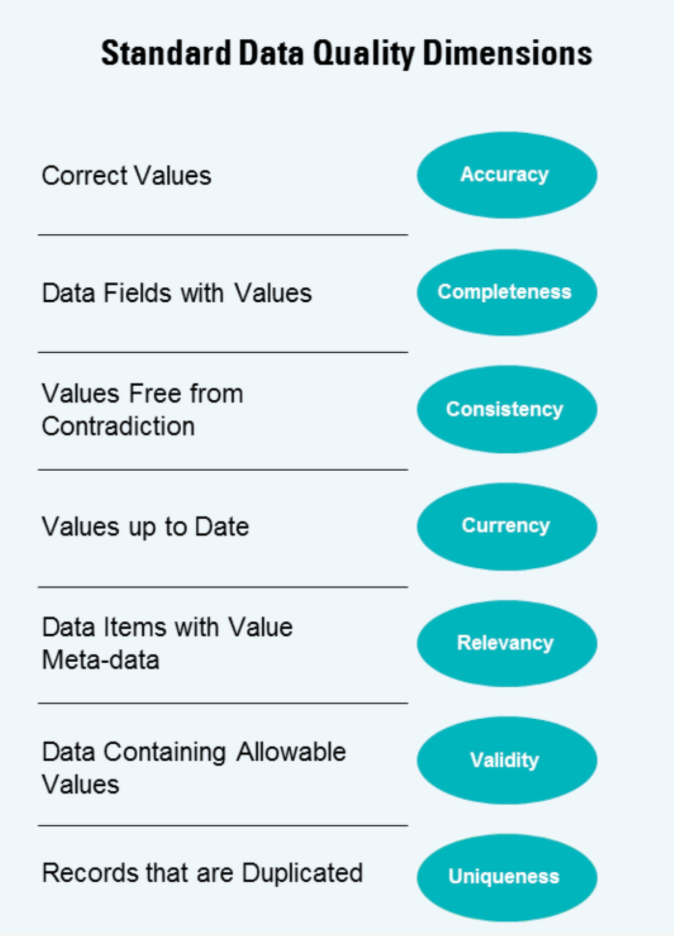
Assessment result:

Task two: Data Insights
The company has given us a new list of 1000 potential customers with their demographics and attributes. However, these customers do not have prior transaction history with the organisation. The marketing team at the company is sure that, if correctly analysed, the data would reveal useful customer insights which could help optimise resource allocation for targeted marketing. Hence, improve performance by focusing on high value customers.
Goal: recommending which of the 1000 new customers should be targeted to drive the most value for the organisation.
Data cleaning
Before we do exploration, we need to clean the data from the three datasets. Let's clean the customer demographic dataset first. I will use Python for this task.
# read the file
df1=pd.read_excel("KPMG_VI_New_raw_data_update_final.xlsx",sheet_name="CustomerDemographic", header=1,parse_dates=['DOB'])
# data modification
# gender
df1['gender'] = df1['gender'].replace(['F'],'Female')
df1['gender'] = df1['gender'].replace(['Femal'],'Female')
df1['gender'] = df1['gender'].replace(['M'],'Male')
df1['gender'] = df1['gender'].replace(['U'],'Unknown')
# rename DOB column
df1.rename(columns={"DOB": "date_of_birth"},inplace=True)
# drop missing values of date_of_birth columns since it is only 87 NAs.
df1= df1.dropna(subset=['date_of_birth'])
# age
# get the actual age ,set the present date(comparison date) to 2/28/2018
df10 = df1[['customer_id', 'date_of_birth']]
present = datetime.date(2018, 2, 28)
present= np.datetime64(present)
year_diff = present-df10['date_of_birth']
year_diff = year_diff.astype('timedelta64[Y]')
year_diff = pd.DataFrame(year_diff)
year_diff.rename(columns={"date_of_birth": "age_in_years"},inplace=True)
df1 = pd.concat([df1, year_diff], axis=1)
# bin the age column into intervals
bins1 = [14,18,29,39,49,59,float('inf')]
labels1 = ['15-17','18-28','29-38','39-48','49-58','59+']
df1['age_range'] = pd.cut(df1['age_in_years'],bins = bins1,labels=labels1)
df1["age_range"].value_counts()
# job_industry_category
df1["job_industry_category"].value_counts()
df1["job_industry_category"].isnull().sum()
df1["job_industry_category"]= df1["job_industry_category"].fillna("Unknown")
# change datatype
df1['customer_id'] = df1['customer_id'].astype(str)
# remove some columns
df1 = df1.drop(['last_name','default','tenure','job_title'],axis=1)
df1.info()
df1[df1.duplicated()] # no duplication
Now the customer demographic dataset is clean. There are no missing values and duplicated values.
The next is the address dataset.
# read second file
df2=pd.read_excel("KPMG_VI_New_raw_data_update_final.xlsx",sheet_name="CustomerAddress", header=1)
df2.info()
# state modification
df2['state']=df2['state'].str.replace("NSW",'New South Wales')
df2['state']=df2['state'].str.replace("VIC",'Victoria')
df2['state']=df2['state'].str.replace("QLD",'Queensland')
# change datatype
df2['customer_id'] = df2['customer_id'].astype(str)
df2['postcode'] = df2['postcode'].astype(str)
df2[df2.duplicated()] # no duplication
Now the address dataset is clean.
The last is the transactions dataset.
# read the third file
df3=pd.read_excel("KPMG_VI_New_raw_data_update_final.xlsx",sheet_name="Transactions", header=1)
df3.info()
# there are some missing values from different columns, but I will delete the NAs from column brand, product_line,product_class,product_size,standard_cost,
product_first_sold_date, since less than 1% missing values.
df3= df3.dropna(subset=['brand'])
df3.info()
# I will further remove missing values from online order column, since only less than
# 2% missing values, also, based on the current distribution of the two classes inside the column,order online or not online seems equal.
df3= df3.dropna(subset=['online_order'])
df3.info() # no missing values
df3['online_order'].value_counts()
# change datatype
df3['transaction_id'] = df3['transaction_id'].astype(str)
df3['product_id'] = df3['product_id'].astype(str)
df3['customer_id'] = df3['customer_id'].astype(str)
df3['online_order'] = df3['online_order'].astype(str)
# replace 1 to Yes, 0 to No for online_order column
df3['online_order']=df3['online_order'].str.replace('1.0','Yes')
df3['online_order']=df3['online_order'].str.replace('0.0','No')
# trim time from the product_first_sold_date column
df3['product_first_sold_date'] = pd.to_datetime(df3['product_first_sold_date']).dt.date
df3['product_first_sold_date'].value_counts()
# since additional customer_ids in the ‘Transactions table’ and ‘Customer Address table’
# but not in ‘Customer Master (Customer Demographic)’, Only customers in the Customer Master list will be used as a training set for our model.
Now the transaction dataset is clean.
# merge three datasets
df6 = df1.merge(df3, on='customer_id', how='left').merge(df2,on='customer_id', how='left')
df6.info()
len(df6['customer_id'].unique())
# 3913 unique customer id, the customer id is consistent with the demographic dataset.
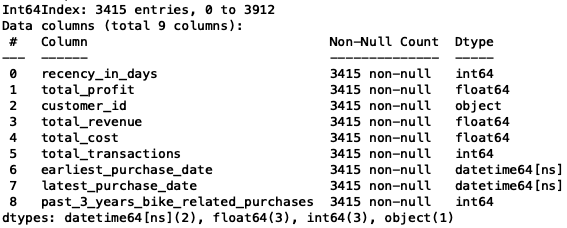
Find the top 1000 customers to promote.
# find the top 1000 customers to promote
total2= pd.DataFrame(df6.groupby(['customer_id'],as_index=False).agg({'list_price':'sum',
'standard_cost':'sum',
'transaction_id':'count',
'transaction_date':['min','max'],
'past_3_years_bike_related_purchases':'count'}))
# renaming
total2.columns = ['customer_id', 'total_revenue', 'total_cost',
'total_transactions', 'earliest_purchase_date',
'latest_purchase_date',
'past_3_years_bike_related_purchases']
total3 = total2[total2.duplicated()] # no duplication
earnings = pd.DataFrame(total2['total_revenue'] - total2['total_cost'],columns=['total_profit'])
# put the new column to total2
total2 = pd.concat([earnings['total_profit'],total2],axis=1)
total2.isnull().sum()
# position missing values
total2.loc[total2['earliest_purchase_date'].isnull()]
# 498 customers didn't purchase anything in 2017, in the past 3 years, they only purchase
# one bike individually, remove them
total2 = total2.dropna()
# create a new column called recency by subtracting a the latest purchase date from the present date which will be created. Let's use 2018/02/28 as the comparison date(present date)
present1 = datetime.date(2018, 2, 28)
present1= np.datetime64(present1)
recency = present1-total2['latest_purchase_date']
recency = pd.DataFrame(recency)
recency.columns = ['recency_in_days']
recency = pd.DataFrame(recency['recency_in_days'].astype('timedelta64[D]').astype(int))
# put the recency back to the total2
df8 = pd.concat([recency['recency_in_days'],total2],axis=1)
df8[df8.duplicated()] # no duplication
df8.isnull().sum() # no missing values
This is the dataset I will use for the customer selection task. And I will use RFM(Recency, Frequency, Monetary) analysis for this customer segmentation task. To know more about RFM analysis, you may google for more detail. But basically, our goal is to find customers who made their first purchases recently and low frequency.
For Recency, calculate the number of days between present date and date of last purchase each customer.
For Frequency, calculate the number of orders for each customer.
For Monetary, calculate sum of purchase price for each customer.
# rename the related columns into recency, frequency, monetary
df8 = df8.rename(columns = {'total_revenue':'monetary',
'total_transactions':'frequency'})
# computing quantile of RFM values and add it to the dataset
df8['recency_quantile'] = pd.qcut(x=df8['recency_in_days'],q=4,labels=['1','2','3','4'])
df8['monetary_quantile'] = pd.qcut(x=df8['monetary'],q=4,labels=['4','3','2','1'])
df8['frequency_quantile'] = pd.qcut(x=df8['frequency'],q=4,labels=['4','3','2','1'])
# combine all three quartiles(r_quartile,f_quartile,m_quartile) in a single column,
# this rank will help you to segment the customers well group.
df8['RFM_score'] = df8['recency_quantile'].astype(str)+ df8['monetary_quantile'].astype(str) + df8['frequency_quantile'].astype(str)
# only select some columns
df9 = df8[['customer_id','recency_in_days','frequency','monetary',
'recency_quantile','frequency_quantile','monetary_quantile','RFM_score']]
# sort rfm score
df9[df9['RFM_score']=='111'].sort_values('monetary', ascending=False).head()
df9.info()
len(set(df9['customer_id'])) # 3415
# convert quantile data type into integer in order to do filtering
df9['recency_quantile'] = df9['recency_quantile'].astype(int)
df9['frequency_quantile'] = df9['frequency_quantile'].astype(int)
df9['monetary_quantile'] = df9['monetary_quantile'].astype(int)
high_new3 = df9.query('recency_quantile== 1 & frequency_quantile == 4')
high_new4 = df9.query('recency_quantile== 1 & frequency_quantile == 3')
high_new5 = df9.query('recency_quantile== 2 & frequency_quantile == 4')
high_new6 = df9.query('recency_quantile== 2 & frequency_quantile == 3')
high_new7 = df9.query('recency_quantile== 1 & frequency_quantile == 2')
# put three groups together
new = pd.concat([high_new3,high_new4,high_new5,high_new6,high_new7])
new.sort_values('monetary',ascending=False)
new.info() # 991 recent customers
new[new.duplicated()] # no duplication
# put the new table to combine with the df8 to retrieve total_profit and
# total_cost
new1 = new.merge(df8,on='customer_id', how='inner')
new1[new1.duplicated()] # no duplication
# only select some columns
new2 = new1[['customer_id','recency_in_days_x','frequency_x','monetary_x',
'recency_quantile_x', 'frequency_quantile_x', 'monetary_quantile_x',
'total_cost','total_profit','RFM_score_x']]
# renaming
new2 = new2.rename(columns = {'recency_in_days_x':'recency_in_days',
'frequency_x':'frequency',
'monetary_x':'monetary',
'recency_quantile_x': 'recency_quantile',
'frequency_quantile_x':'frequency_quantile',
'monetary_quantile_x':'monetary_quantile',
'RFM_score_x':'RFM_score'})
new2.shape # (991, 10)
# put this table to combine with the df6 to get the customers' information
df12 = df6[['customer_id','first_name','gender','date_of_birth','age_in_years',
'age_range','job_industry_category','wealth_segment','address','postcode',
'state','country','property_valuation']]
# merge this table with new2 table
new4 = new2.merge(df12,on='customer_id',how='inner')
new4.shape # (4695, 22)
new4[new4.duplicated()] # 3704 duplication, drop them
new4 = new4.drop_duplicates()
len(set(new4['customer_id'])) # 991
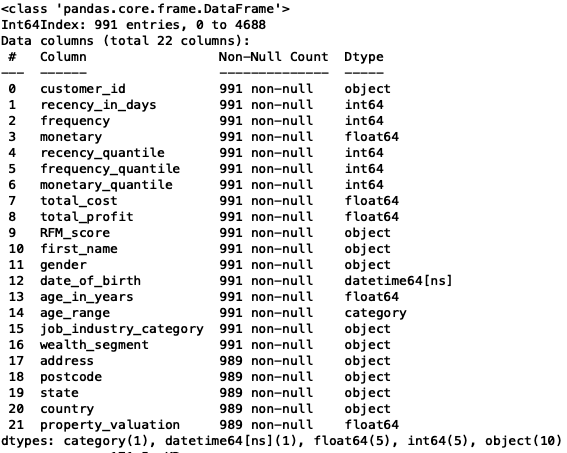
We have identified the new 991 customers. Although we have two missing values from some columns, but it doesn't hurt our analysis.
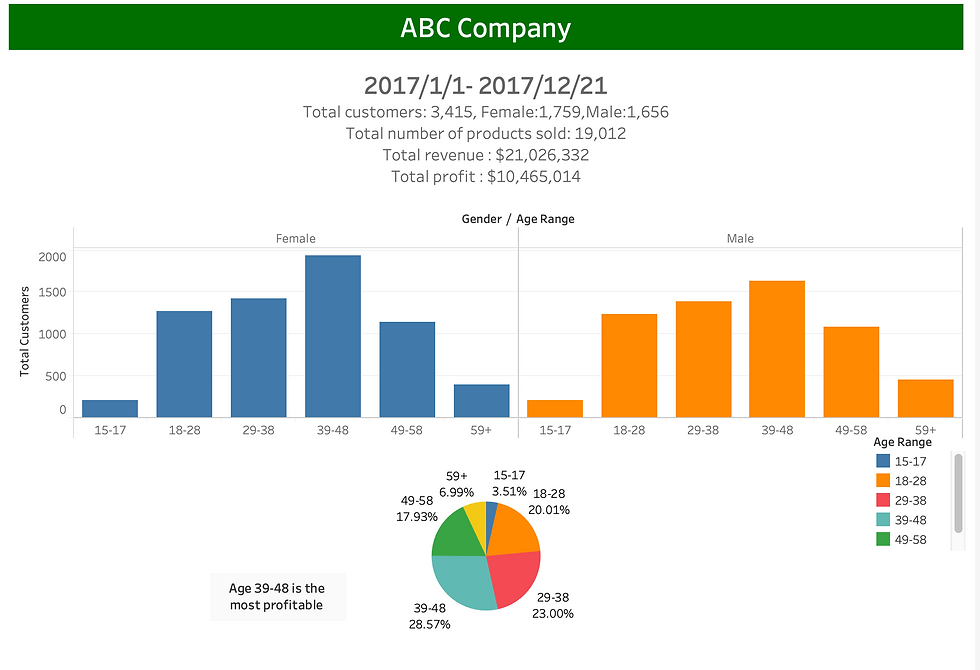
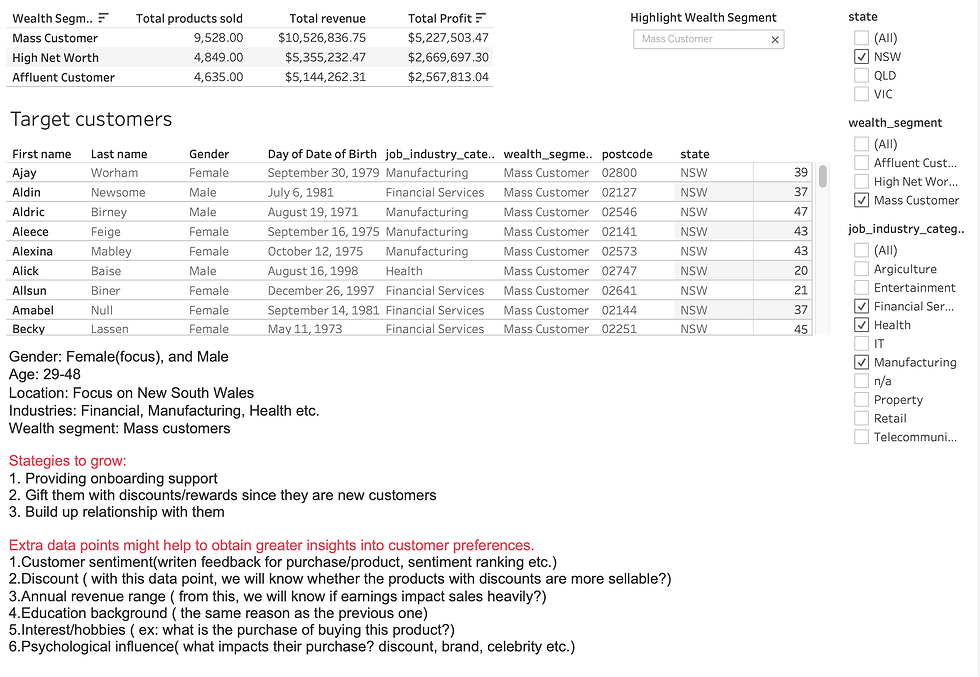
Task three: Dashboard presentation
This task is to present the whole process I did from task one to task two.
We need to do data summary and results of the analysis in a dashboard (see tools/references for assistance). Specifically, we need to answer the following questions in this task. I will use Tableau for this task.
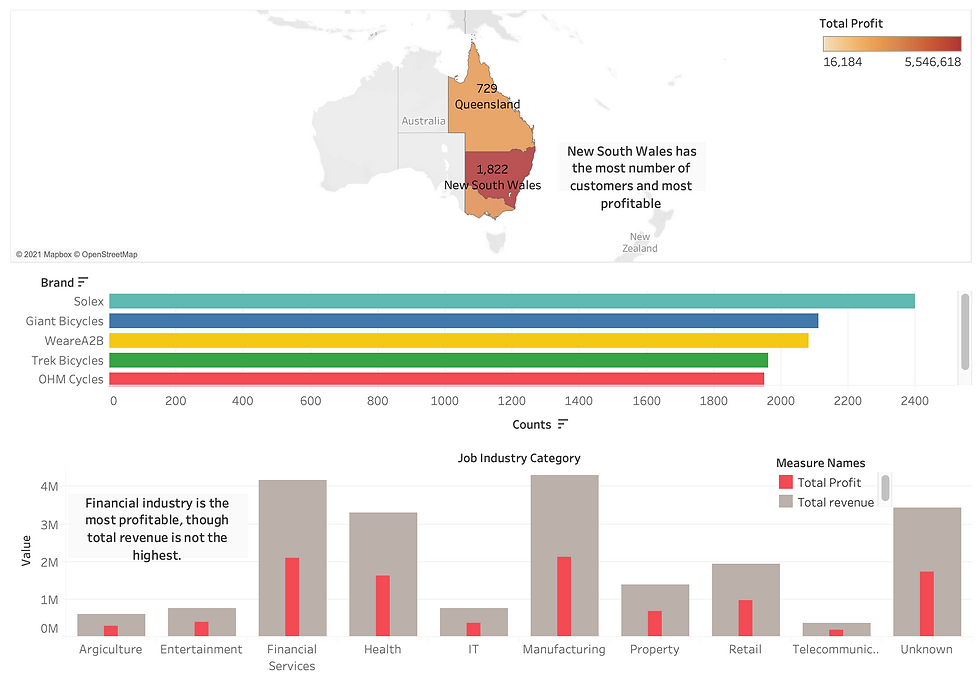
1.What are the trends in the underlying data? 2.Which customer segment has the highest customer value?
3.What do you propose should be the company ’s marketing and growth strategy?
4.What additional external datasets may be useful to obtain greater insights into customer preferences and propensity to purchase the products?
Let's check the dashboard.


Comments